Nov 16, 2015 Kai Keppner
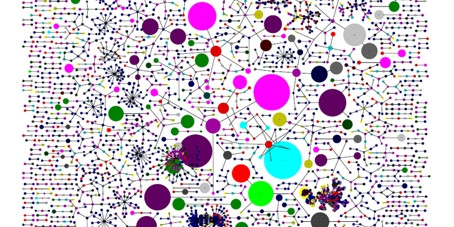
ShareI bet you did not think about optimization problems in logistics when you first looked at the picture above. A picture like this would not be out of place in a gallery of modern art. Actually it represents a bill of materials structure from one of our supply chain projects, which was visualized by a gozinto graph. The structure consists of 5564 nodes and 4074 edges. Each node represents a finished product or a pre-product (raw material not included). Nodes of the same color require the same production resource. The size of a node depends on which share of a resource’s capacity the respective product consumes.
The picture is not a snap-shot, but an aggregation of 52 different pictures. For each week of one year, the utilization of production capacities was mapped in this way and finally joined together. The goal was not, of course, to put a piece of modern art into a frame, but to identify possible bottlenecks. The picture’s complexity becomes apparent when you look at some details:
The artist’s name: Graph Partitioning
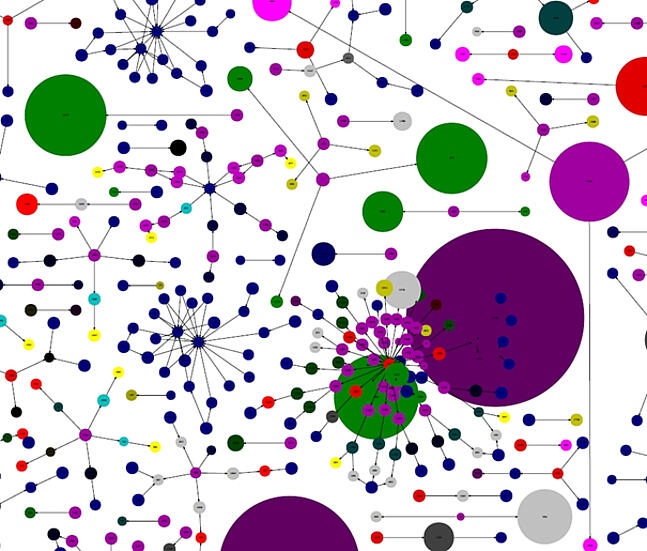
Another example of algorithms transforming into art from our daily project routine at INFORM comes from workforce planning of service technicians. The picture below shows the geographical distribution of job locations in two metropolitan areas:
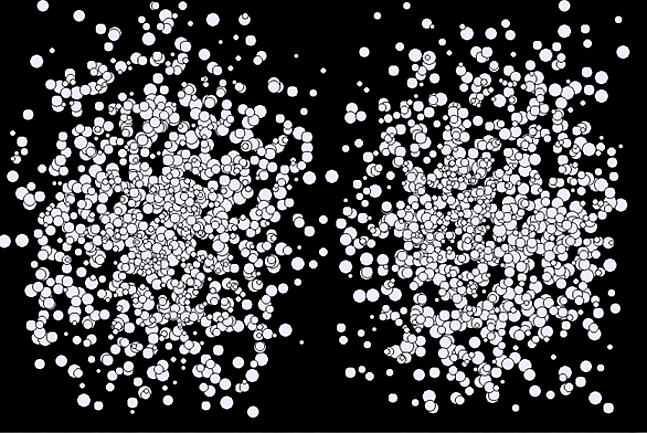
The different jobs are initially shown as white spheres. The spheres’ size is proportional to the expected job duration. The goal here is to cluster jobs with short distances so that the workload in each cluster is nearly the same. This is executed by the so called Graph Partitioning. With this method, a complex problem is divided into multiple easier to solve sub-problems. The result in our current example is the colorful picture below:
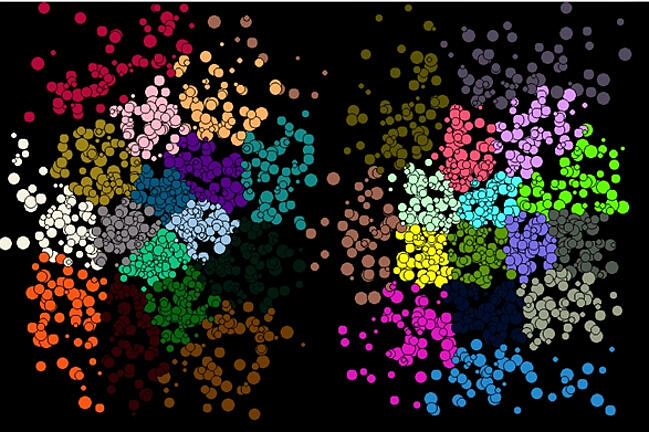
As you can see this representation can also claim some sort of artistic value – and at the same time articulately demonstrates the result of the algorithm.
By using Graph Partitioning a formerly computationally intensive challenge becomes a task which can be solved in an acceptable time for practical use. Graph Partitioning aggregates the particular sub-solutions to an optimal total solution. The currently known most effective algorithm of Graph Partitioning was developed by INFORM and is also part of our software. The particular algorithm (in certain circles known as FSMAGP) completed a benchmark text in 2012 with different problems from the Graph Partitioning Archive and is regarded as the best solution for more than half of the problems listed there.
Aircraft scheduling
The last example originates from the area of aircraft scheduling. The picture below deals with the assignment of airliners to certain flight routes with optimal utilization of maintenance ranges. Depending on type, airplanes need to be maintained e.g. after a maximum of two days, which is operated in defined maintenance bases.
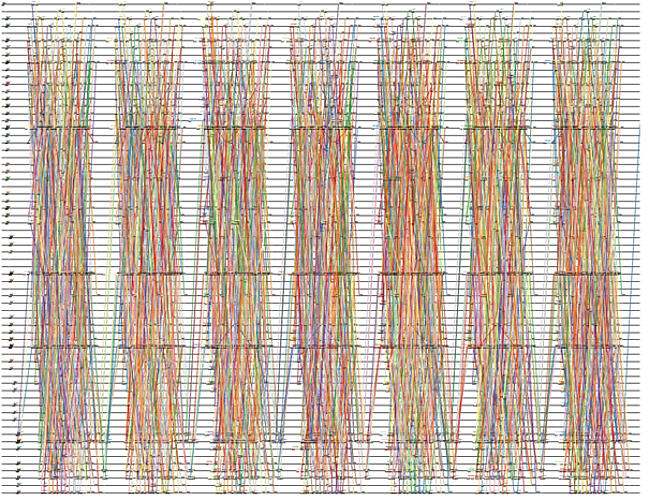
What roughly looks like several bundles of colored straws are flight routes of airliners in different colors, put on a time axis. In the example, 3498 flights over 7 days can be seen, which are piloting 68 airports (on the vertical axis).
Mathematical art
In all of my examples, art is a byproduct of actual operations research applications. But the opposite also holds true: Some artisans make use of mathematics to create their artwork. For example, Julian Lethbridge was inspired by the Traveling Salesman problem for some of his works, which is also the case for Robert Bosch. You can even visit dedicated exhibitions dealing with the connection of mathematics and art, e.g. in the Arithmeum in Bonn.
There is one deciding advantage of art originated from operations research compared to “primary” art: You can skip on the excessive attempts to see through the artisan’s motives. In the case of mathematical art the challenge is quite different – figuring out which algorithm lies behind a bunch of dots or lines.
About our Expert


